
Executive Summary 2Fort Worth-Arlington, Texas Comprehensive Housing Market Analysis as of April 1, 2021
Comprehensive Housing Market Analysis Fort Worth-Arlington, Texas
U.S. Department of Housing and Urban Development, Office of Policy Development and Research
Executive Summary
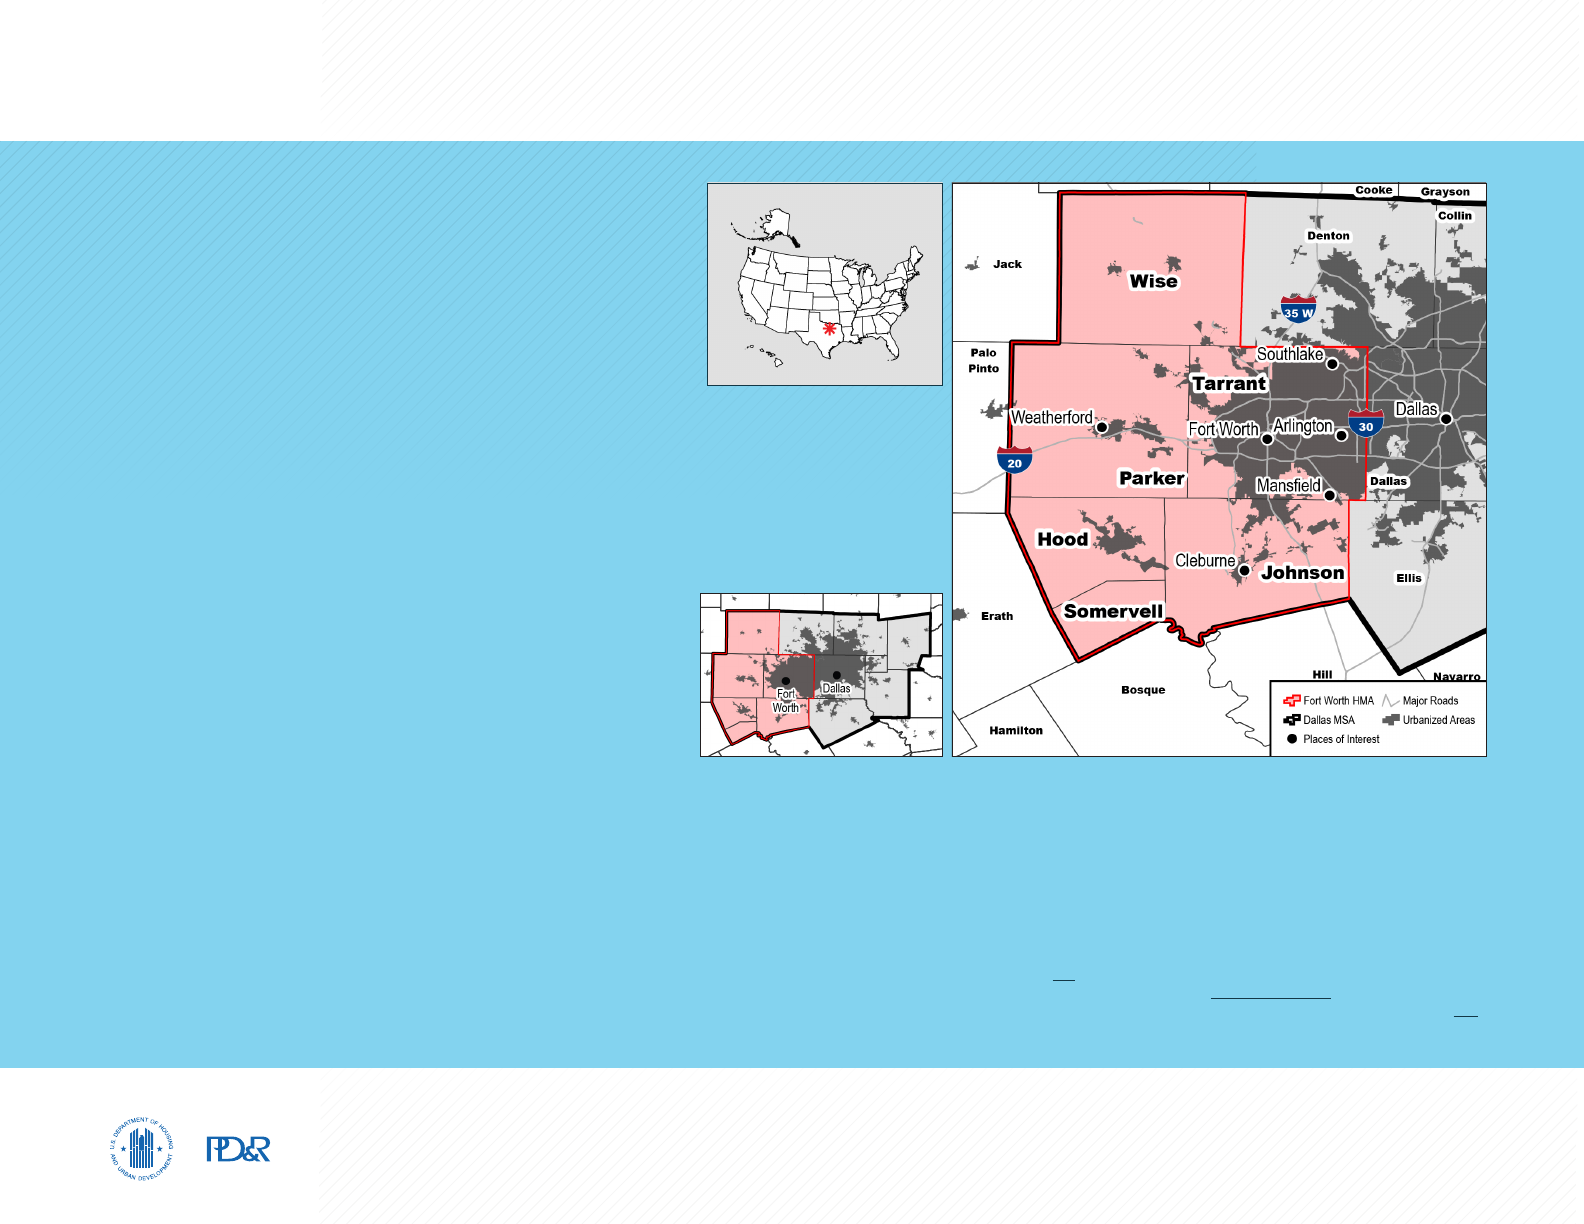
Housing Market Area Description
The Fort Worth-Arlington Housing Market Area
(hereafter, Fort Worth HMA) is coterminous with the
Fort Worth-Arlington, TX Metropolitan Division, which
makes up the western portion of the Dallas-Fort Worth-
Arlington, TX Metropolitan Statistical Area (MSA) in
north central Texas. The HMA has six counties: Hood,
Johnson, Parker, Somerville, Tarrant, and Wise. The
principal cities of Fort Worth and Arlington are located
in Tarrant County.
The current HMA population is estimated at 2,614,000.
Because of its cattle drive history and the construction
of the Texas and Pacific Railway in the late 1800s, the
principal city of Fort Worth became a livestock and
meatpacking center, earning the moniker of “Cowtown.”
The Dallas Fort Worth International Airport—primarily
in Tarrant County—serves as the main hub for the
American Airlines Group Inc. and in 2020 was the fourth
busiest airport in the world.
Tools and Resources
Find interim updates for this metropolitan area, and select geographies nationally,
at PD&R’s Market-at-a-Glance tool.
Additional data for the HMA can be found in this report’s supplemental tables.
For information on HUD-supported activity in this area, see the Community Assessment Reporting Tool.
Executive Summary 3Fort Worth-Arlington, Texas Comprehensive Housing Market Analysis as of April 1, 2021
Comprehensive Housing Market Analysis Fort Worth-Arlington, Texas
U.S. Department of Housing and Urban Development, Office of Policy Development and Research
Market Qualifiers
The pace of job growth slowed during the first
quarter of 2021, partly due to a decline in nonfarm
payrolls in February, when a catastrophic ice storm
caused many businesses to temporarily close.
During the 3 months ending March 2021, nonfarm
payrolls in the HMA declined by 41,000 jobs, or
3.7 percent, to 1.06 million jobs; this decline followed
an increase of 25,300 jobs, or 2.4 percent, during
the same period a year earlier. During the 3-year
forecast period, nonfarm payrolls are expected to
increase at an average annual rate of 2.7 percent,
with notable growth expected in both goods-
producing and service-providing sectors.
The sales housing market in the HMA is currently
tight, with an estimated vacancy rate of 1.3 percent,
down from 2.1 percent in 2010. During the 12
months ending March 2021, the average existing
home sales price increased 8 percent to $283,600,
and the average new home sales price increased
2 percent to $322,800 (Zonda, with adjustments
by the analyst). During the next 3 years, demand is
estimated for 28,700 new homes. The 4,275 homes
under construction will satisfy some of the demand
in the first year of the forecast period.
Rental market conditions are balanced in the HMA
as of April 1, 2021, due to an increased propensity
to rent in the HMA since 2010. Apartment market
conditions are also balanced, with a vacancy
rate of 5.6 percent during the first quarter of
2021, nearly unchanged from a year ago. The
average apartment market rent during the first
quarter of 2021 increased 4 percent to $1,132
from a year earlier (RealPage, Inc.). During the
forecast period, demand is estimated for 18,000
new rental units; the 12,700 units currently under
construction will meet part of that demand.
Economy
Weak, but Improving: Although
69 percent of jobs lost due to the
effects of the COVID-19 pandemic
have been recovered, the pace of
job recovery has been uneven in
the Fort Worth HMA.
Rental Market
Balanced: The overall rental
vacancy rate is currently
estimated at 7.2 percent, down
from 11.7 percent in April 2010
when the market was soft.
Sales Market
Tight: The inventory of homes
available for sale in March 2021
fell by nearly 66 percent from a
year earlier.
TABLE OF CONTENTS
Economic Conditions 4
Population and Households 9
Home Sales Market 11
Rental Market 15
Terminology Definitions and Notes 18
Notes: Total demand represents estimated production necessary to achieve a balanced market at the end of the forecast period. Units under
construction as of April 1, 2021. The forecast period is April 1, 2021, to April 1, 2024.
Source: Estimates by the analyst
3-Year Housing Demand Forecast
Sales Units Rental Units
Fort Worth HMA
Total Demand 28,700 18,000
Under Construction 4,275 12,700

Economic Conditions 4Fort Worth-Arlington, Texas Comprehensive Housing Market Analysis as of April 1, 2021
Comprehensive Housing Market Analysis Fort Worth-Arlington, Texas
U.S. Department of Housing and Urban Development, Office of Policy Development and Research
Economic Conditions
Largest Sector: Wholesale and Retail Trade
On a monthly basis, nonfarm payrolls
in the wholesale and retail trade sector
surpassed pre-pandemic (February 2020)
levels in October 2020 and continued to
increase through December but fell in
January and February 2021.
Primary Local Economic Factors
Originally an outpost to the western frontier of
Texas, Tarrant County evolved into a manufacturing
and transportation hub in the 1900s and a
burgeoning financial center for north Texas in the
2000s. Refineries moved to the HMA following
the discovery of oil in 1901, and the aviation
industry expanded around the Naval Air Station
Joint Reserve Base (formerly known as Carswell
Air Force Base) during World War II. Five of the
six counties in the HMA are part of the Barnett
Shale natural gas fields. Advances in natural gas
extraction used in the fields led to the Barnett
Shale becoming one of the most productive
natural gas fields in the United States during the
2000s and contributed to an increase in mining,
logging, and construction jobs in the HMA. Since
the early 2000s, Fidelity Investments and Deloitte
have opened large campuses in the Circle T Ranch
portion of the AllianceTexas development.
The manufacturing and the transportation and
utilities sectors have a significant impact on the
Name of Employer Nonfarm Payroll Sector Number of Employees
American Airlines Group Inc. Transportation & Utilities 25,000
Lockheed Martin Corporation Manufacturing 13,700
Texas Health Resources Education & Health Services 12,000
Naval Air Station Joint Reserve Base Fort Worth* Government 10,000
The University of Texas at Arlington Government 8,500
JPS Health Network Education & Health Services 6,500
City of Fort Worth Government 6,150
Cook Children’s Health Care System Education & Health Services 6,050
Tarrant County College Education & Health Services 6,000
Alcon Inc. Manufacturing 5,400
Table 1. Major Employers in the Fort Worth HMA
*Data include military personnel, who are generally not included in nonfarm payroll survey data.
Note: Excludes local school districts.
Source: Fort Worth Chamber of Commerce
local economy. With generally high-paying jobs, the manufacturing sector has been historically centered
around the aerospace and defense industry in the HMA. Companies such as Lockheed Martin Corporation,
which is the second largest employer in the HMA, and Bell Textron Inc. have manufacturing facilities in the
HMA (Table 1). In 2020, Bell Textron Inc. built a new manufacturing technology center in the city of Fort
Worth. The company is collaborating with Lockheed Martin Corporation to build the V-280 Valor, a tiltrotor
aircraft for the United States Army Future Vertical Lift program. Since 2015, the transportation and utilities
sector has grown the fastest of all the sectors, with an average growth rate of 4.4 percent, or 3,500
jobs, annually, because of the growing popularity of e-commerce. Some of this job growth has been at
companies located in AllianceTexas, a master-planned mixed-use community based around the Fort Worth
Alliance Airport in northern Fort Worth. The UPS Ground Hub, J.B. Hunt Transport Services, Inc., BNSF
Railway Company Alliance Intermodal Facility, and two The Kraft Heinz Company warehouses are some of
the facilities located in the development. Since 2015, the financial activities sector was the second fastest
growing sector in the HMA. The Charles Schwab Corporation opened a temporary office in AllianceTexas
in 2015, prior to moving their corporate offices to the northern part of the Circle T Ranch development. In
2018, TD Ameritrade, Inc., moved its two Fort Worth offices to a new, $123-million complex in the city of
Southlake to accommodate future expansion and expand their potential employee base to include people
from Dallas County.

Economic Conditions 5Fort Worth-Arlington, Texas Comprehensive Housing Market Analysis as of April 1, 2021
Comprehensive Housing Market Analysis Fort Worth-Arlington, Texas
U.S. Department of Housing and Urban Development, Office of Policy Development and Research
Current Conditions—
COVID-19 Related Restrictions
and Nonfarm Payrolls
In March 2020, executive orders intended to
mitigate the spread of COVID-19 were issued
by the governor of Texas. Since April 2020, the
governor issued a series of executive orders
aimed at achieving less restrictive COVID-19
countermeasures while continuing certain social-
distancing restrictions to safely reopen the Texas
economy. By October 2020, most establishments
were allowed to operate at 75 percent capacity,
and in March 2021, the governor allowed
establishments in the state to operate at
100 percent capacity, with a caveat allowing
county judges to use some COVID-19 mitigation
strategies restricting businesses to 50 percent
capacity under highly defined circumstances
of increased COVID-19 hospitalizations.
Although nonfarm payrolls are down considerably
year-over-year, 69 percent of the 126,200
jobs lost during March and April of 2020—as
a consequence of the efforts used to slow the
spread of COVID-19, including enforcing social
distancing and health safety standards—were
recovered by March 2021 (not seasonally
adjusted). Despite this partial recovery of jobs,
economic conditions remain weak. During the
3 months ending March 2021, payrolls declined
by 41,000 jobs, or 3.7 percent, compared with the
same 3-month period a year earlier. Those losses, however, were less than the job decline that occurred
during the 12 months ending March 2021, which captured all of the initial job losses due to the pandemic.
During the 12 months ending March 2021, payrolls totaled 1.04 million, reflecting a decrease of 56,100
jobs, or 5.1 percent (Table 2), compared with the same 12-month period a year ago. During the 12 months
ending March 2021, 10 of the 11 employment sectors lost jobs, with the majority of job losses in the
service-providing sectors. The leisure and hospitality sector, which fell by 24,200 jobs, or 19.2 percent, led
the decline and accounted for 43 percent of the total job losses in the HMA.
Approximately 79 percent of jobs lost in this sector were in the accommodation and food services industry,
which declined by 19,100 jobs, or 17.8 percent. The decline is due to limited travel to the HMA during this
period, as well as the countermeasures used to limit the contagion of COVID-19. The countermeasures
to limit COVID-19, however, resulted in a rise in the demand for e-commerce goods, which caused an
increase in warehouse construction and jobs in the transportation and utilities sector. The construction
Table 2. 12-Month Average Nonfarm Payroll Jobs (1,000s) in the Fort Worth HMA, by Sector
12 Months Ending
March 2020
12 Months Ending
March 2021
Absolute Change Percentage Change
Total Nonfarm Payroll Jobs 1,098.6 1,042.5 -56.1 -5.1
Goods-Producing Sectors 179.2 171.2 -8.0 -4.5
Mining, Logging, & Construction 76.5 72.6 -3.9 -5.1
Manufacturing 102.7 98.6 -4.1 -4.0
Service-Providing Sectors 919.3 871.3 -48.0 -5.2
Wholesale & Retail Trade 176.1 174.2 -1.9 -1.1
Transportation & Utilities 91.4 91.9 0.5 0.5
Information 10.8 9.4 -1.4 -13.0
Financial Activities 68.5 67.5 -1.0 -1.5
Professional & Business Services 123.6 118.7 -4.9 -4.0
Education & Health Services 142.1 135.4 -6.7 -4.7
Leisure & Hospitality 125.8 101.6 -24.2 -19.2
Other Services 42.3 36.6 -5.7 -13.5
Government 138.7 136.1 -2.6 -1.9
Notes: Based on 12-month averages through March 2020 and March 2021. Numbers may not add to totals due to rounding. Data are in thousands.
Source: U.S. Bureau of Labor Statistics
Economic Conditions 6Fort Worth-Arlington, Texas Comprehensive Housing Market Analysis as of April 1, 2021
Comprehensive Housing Market Analysis Fort Worth-Arlington, Texas
U.S. Department of Housing and Urban Development, Office of Policy Development and Research
of industrial warehouses and facilities in the HMA increased during this time
and partly offset the decline of jobs in the mining, logging, and construction
sector, which were down by 3,900 jobs, or 5.1 percent, during the 12 months
ending March 2021. The transportation and utilities sector, which accounts
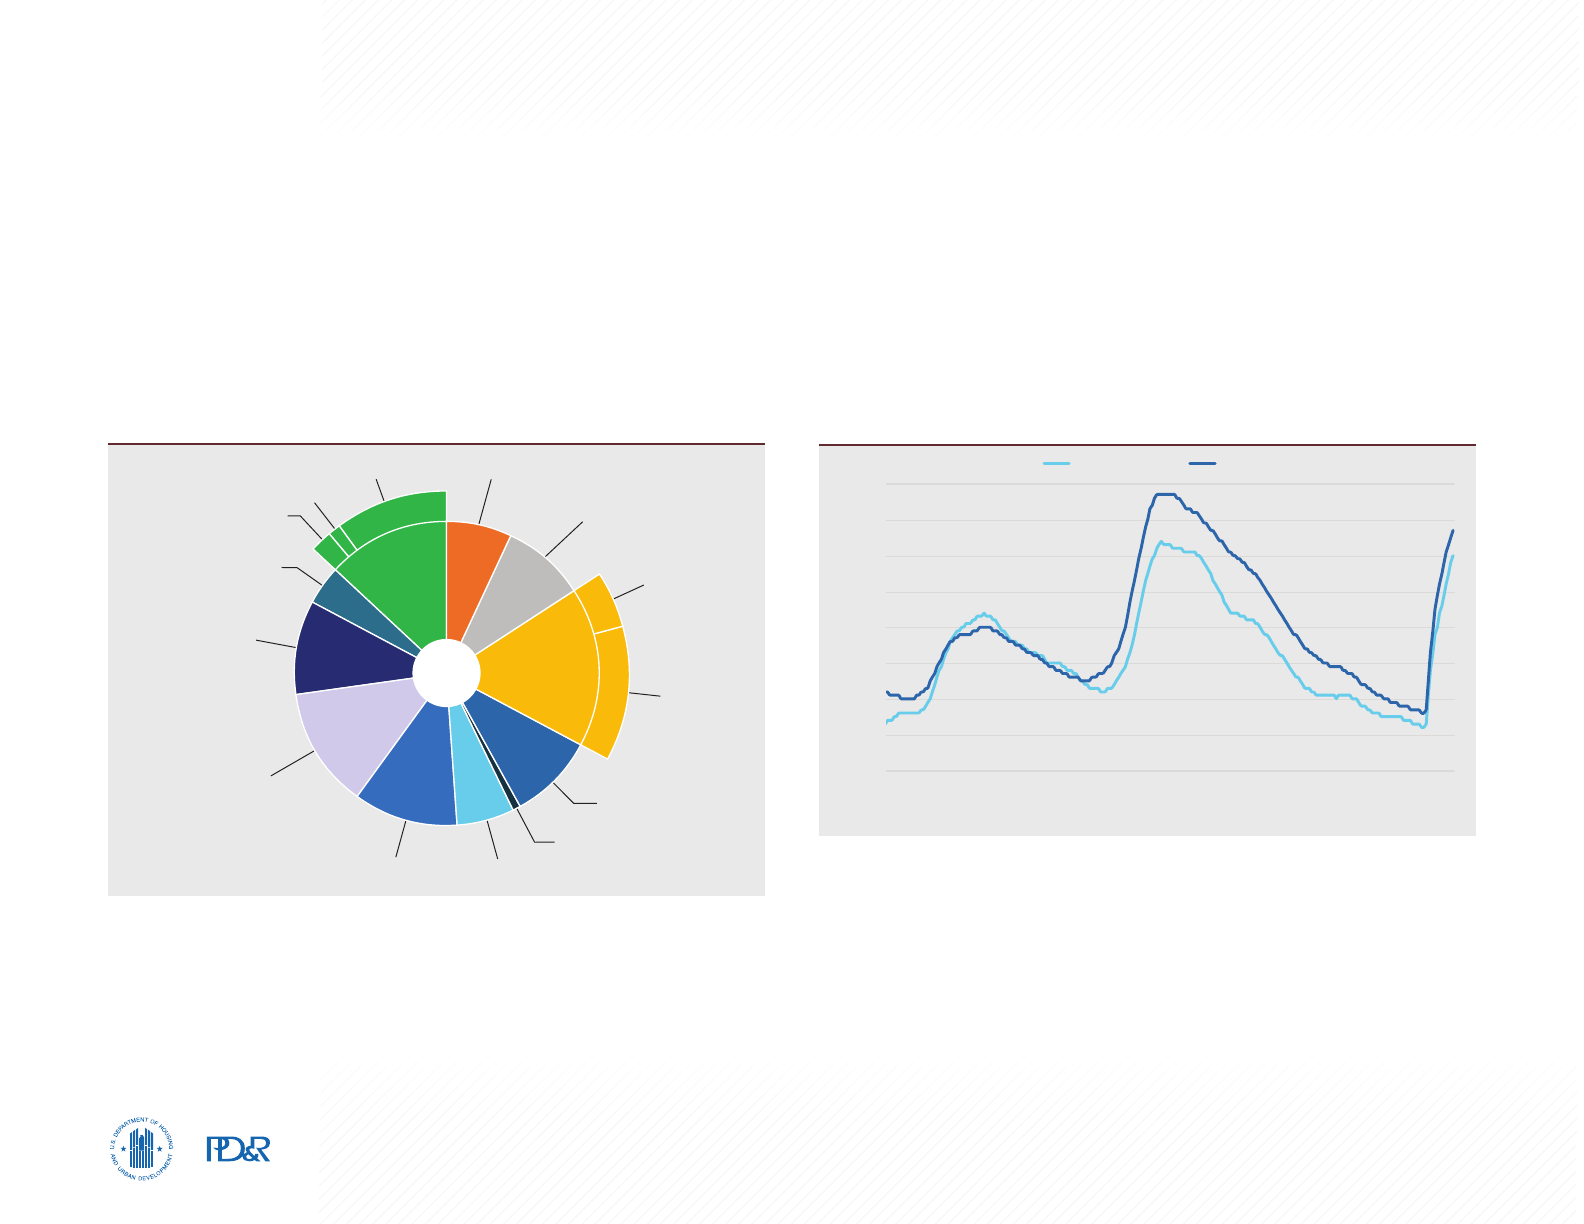
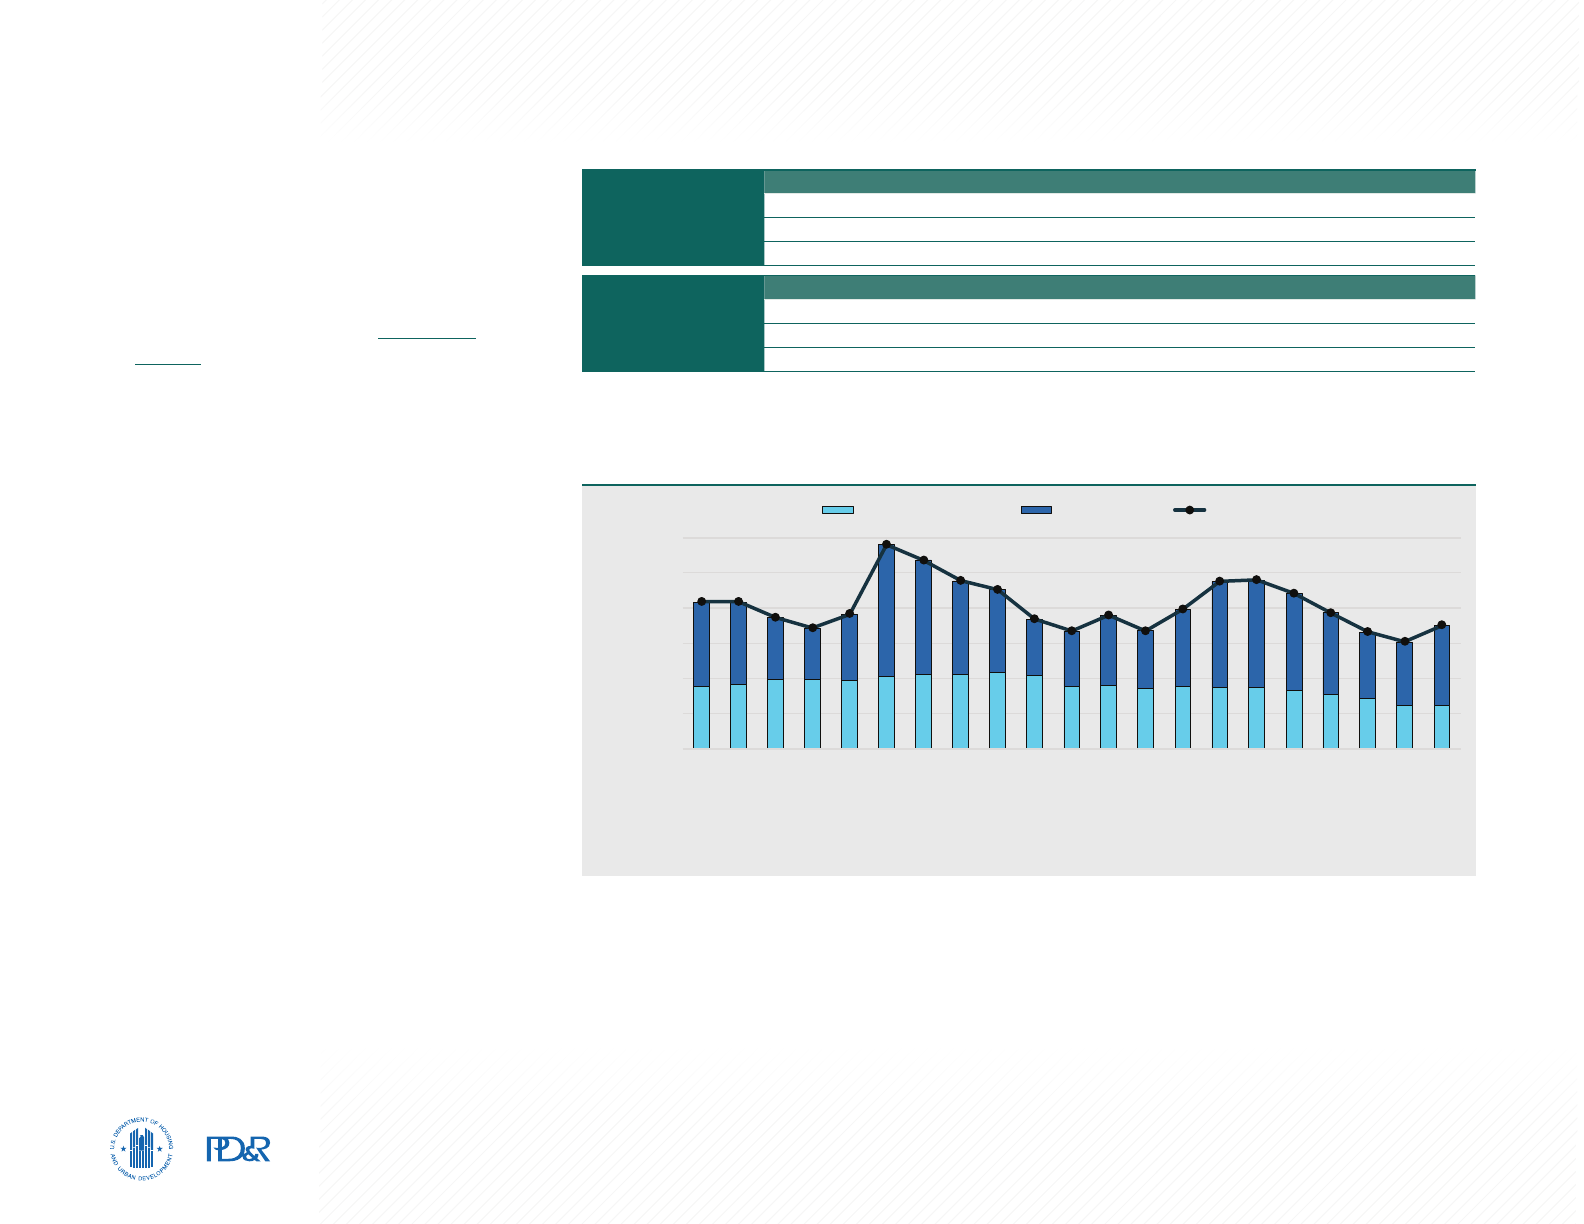
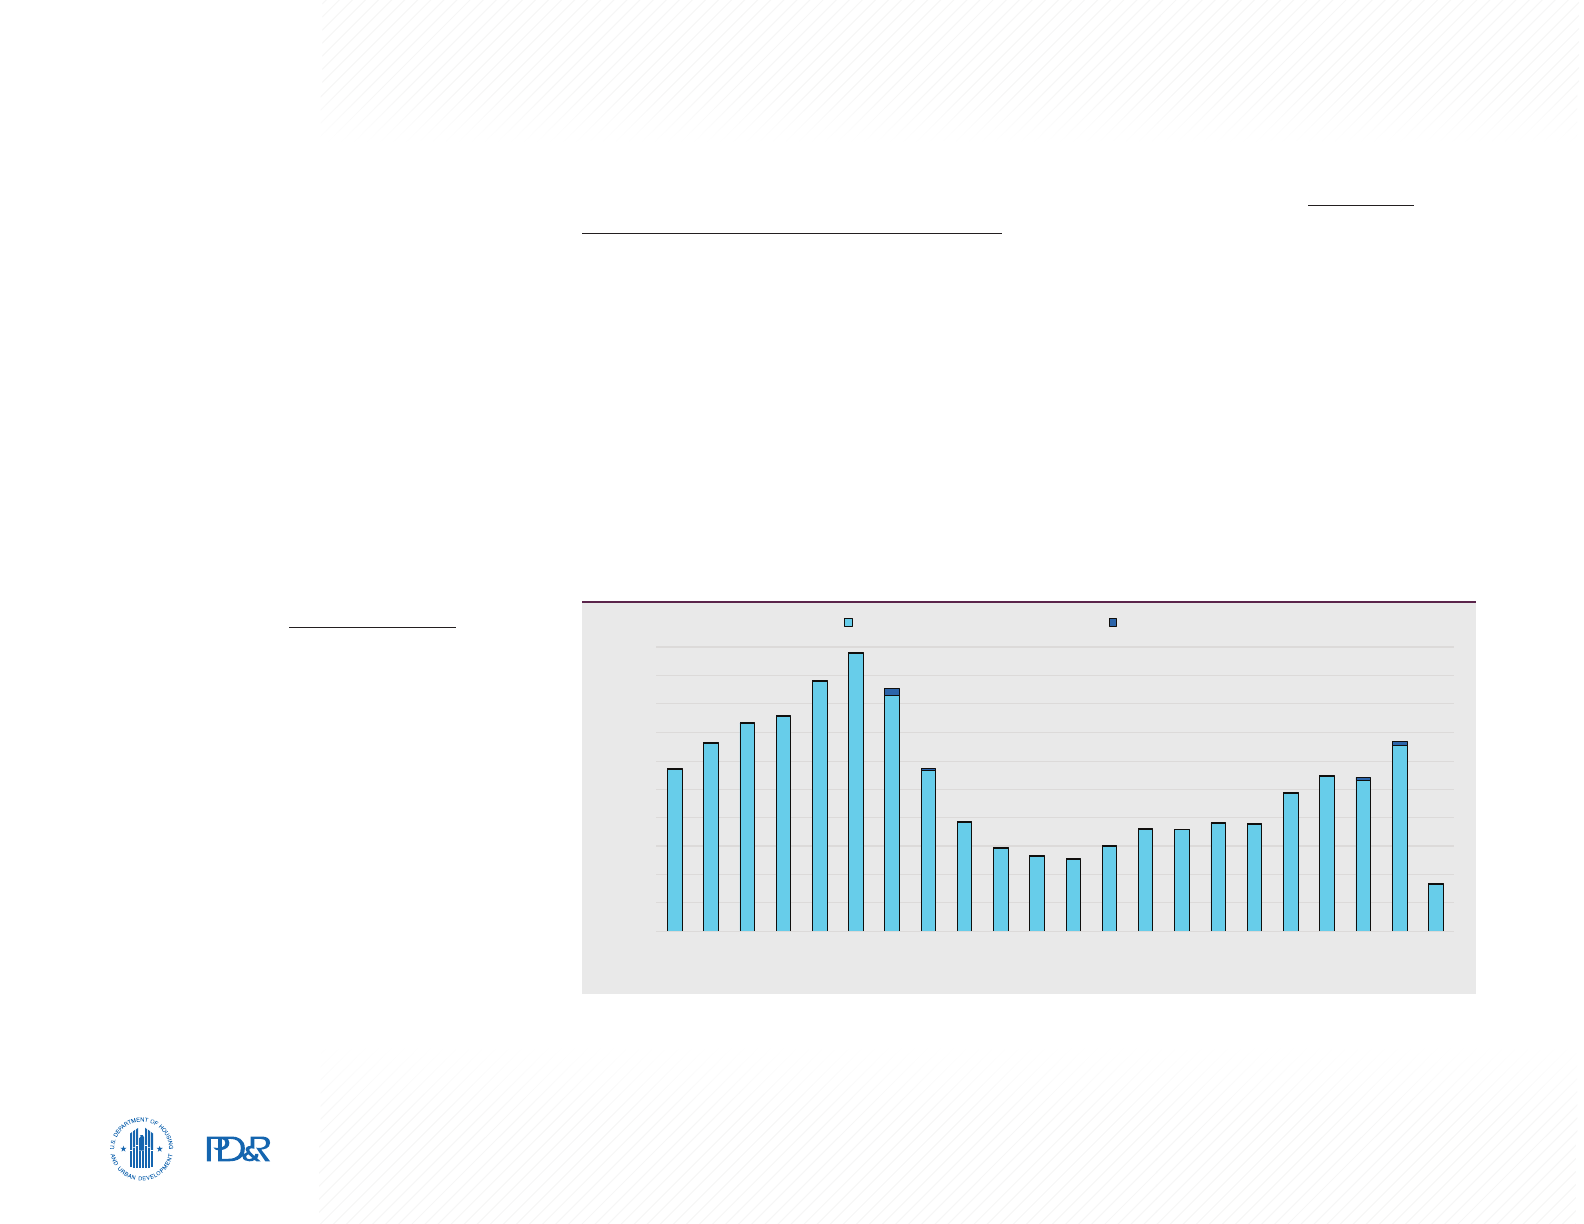
for 9 percent of the jobs in the HMA, was the only sector to expand (Figure 1).
Partly attributed to the growth of e-commerce, the transportation and utilities
sector increased by 500 jobs, or 0.5 percent, compared with 4,500 jobs, or
5.2 percent, added a year earlier.
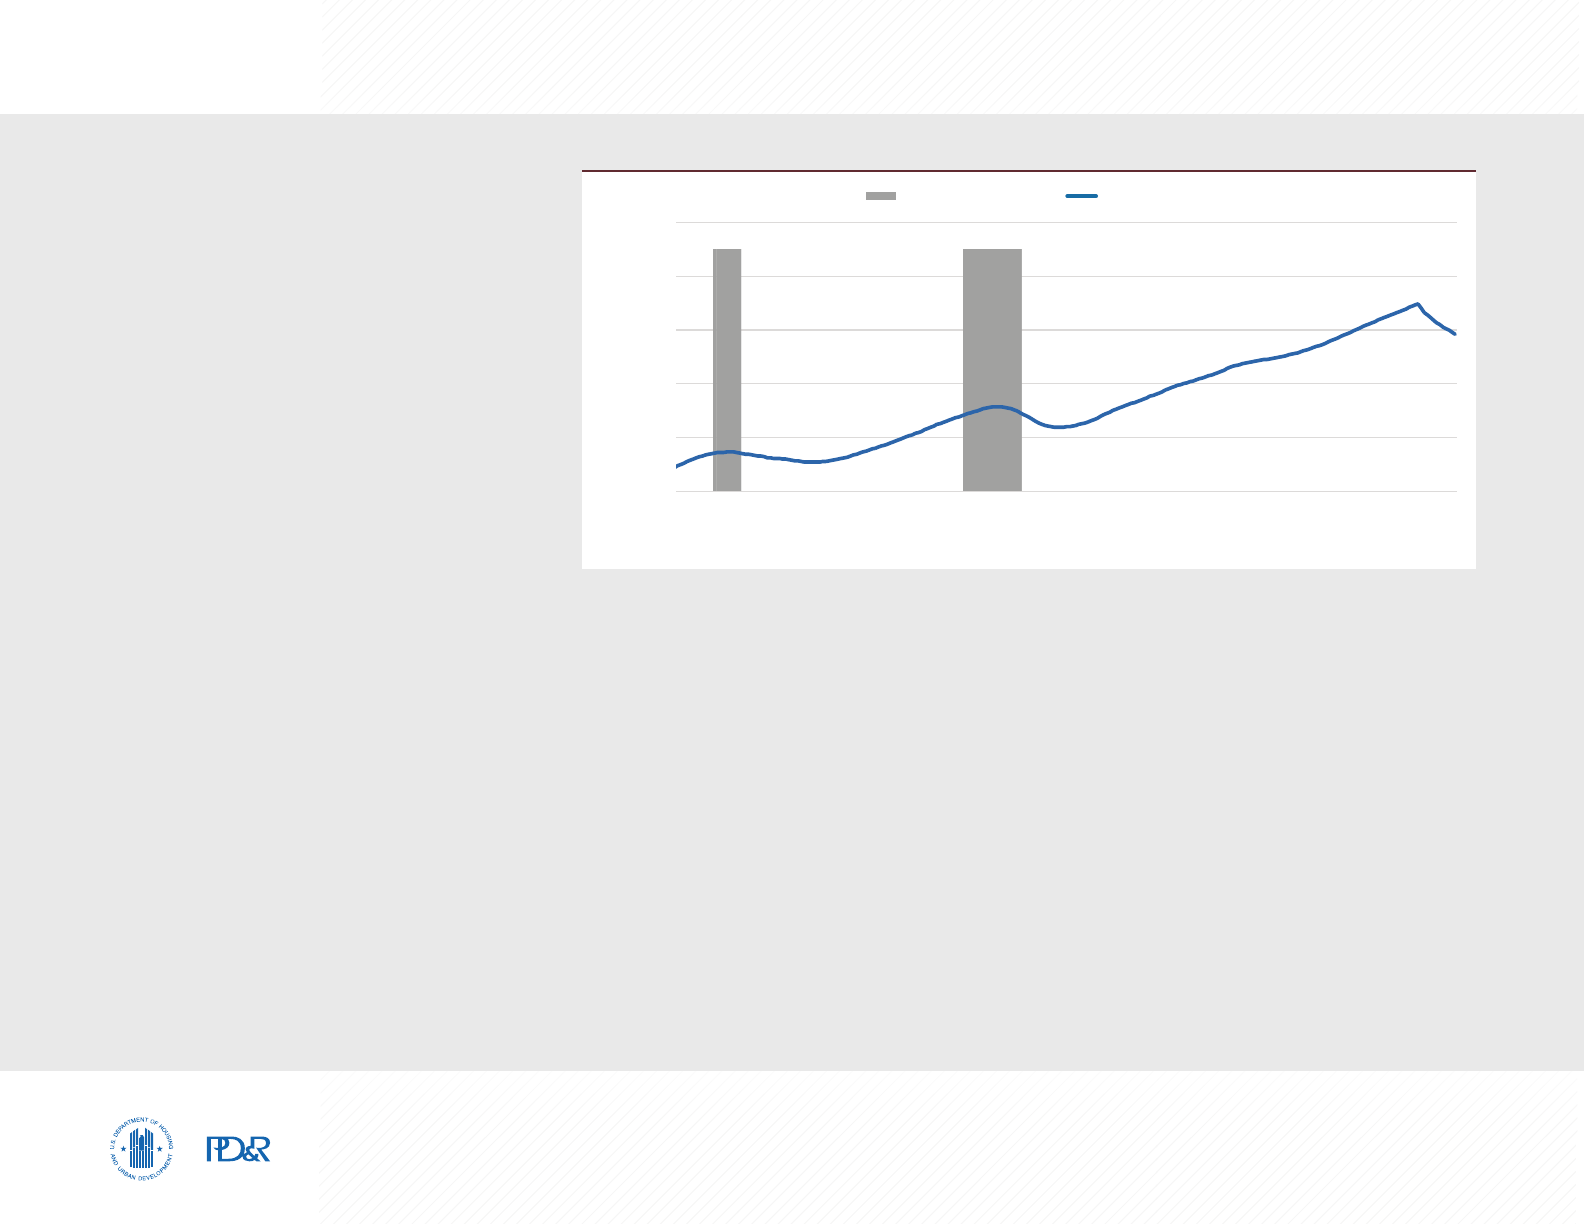
Current Conditions—Unemployment
Significant job losses occurred during the past year because of COVID-19
containment measures. The unemployment rate averaged 8.0 percent during
the 12 months ending March 2021, up from 3.3 percent during the previous
12 months but down from the recent 12-month peak of 8.4 percent during
May 2010 (Figure 2). By comparison, the unemployment rate in the nation
averaged 8.7 percent during the 12 months ending March 2021, up from
3.7 percent a year earlier.
10.0
9.0
8.0
7.0
6.0
5.0
4.0
3.0
2.0
Mar-00
Mar-01
Mar-02
Mar-03
Mar-04
Mar-05
Mar-06
Mar-07
Mar-08
Mar-09
Mar-10
Mar-11
Mar-12
Mar-13
Mar-14
Mar-15
Mar-16
Mar-17
Mar-18
Mar-19
Mar-20
Mar-21
Unemployment Rate (%)
Fort Worth HMA Nation
Note: Based on the 12-month moving average.
Source: U.S. Bureau of Labor Statistics
Figure 2. 12-Month Average Unemployment Rate
in the Fort Worth HMA and the Nation
Education &
Health Services 13%
Mining, Logging, & Construction 7%
Manufacturing 9%
Transportation
& Utilities 9%
Information 1%
Financial Activities 6%
Professional & Business Services 11%
Leisure &
Hospitality 10%
Other Services 4%
Federal 2%
State 1%
Local 10%
Total
1,042.5
Government
13%
Wholesale
5%
Trade 17%
Retail
12%
Notes: Total nonfarm payroll is in thousands. Percentages may not add to 100 percent due to rounding.
Based on 12-month averages through March 2021.
Source: U.S. Bureau of Labor Statistics
Figure 1. Share of Nonfarm Payroll Jobs in the Fort Worth HMA, by Sector
Economic Conditions 7Fort Worth-Arlington, Texas Comprehensive Housing Market Analysis as of April 1, 2021
Comprehensive Housing Market Analysis Fort Worth-Arlington, Texas
U.S. Department of Housing and Urban Development, Office of Policy Development and Research
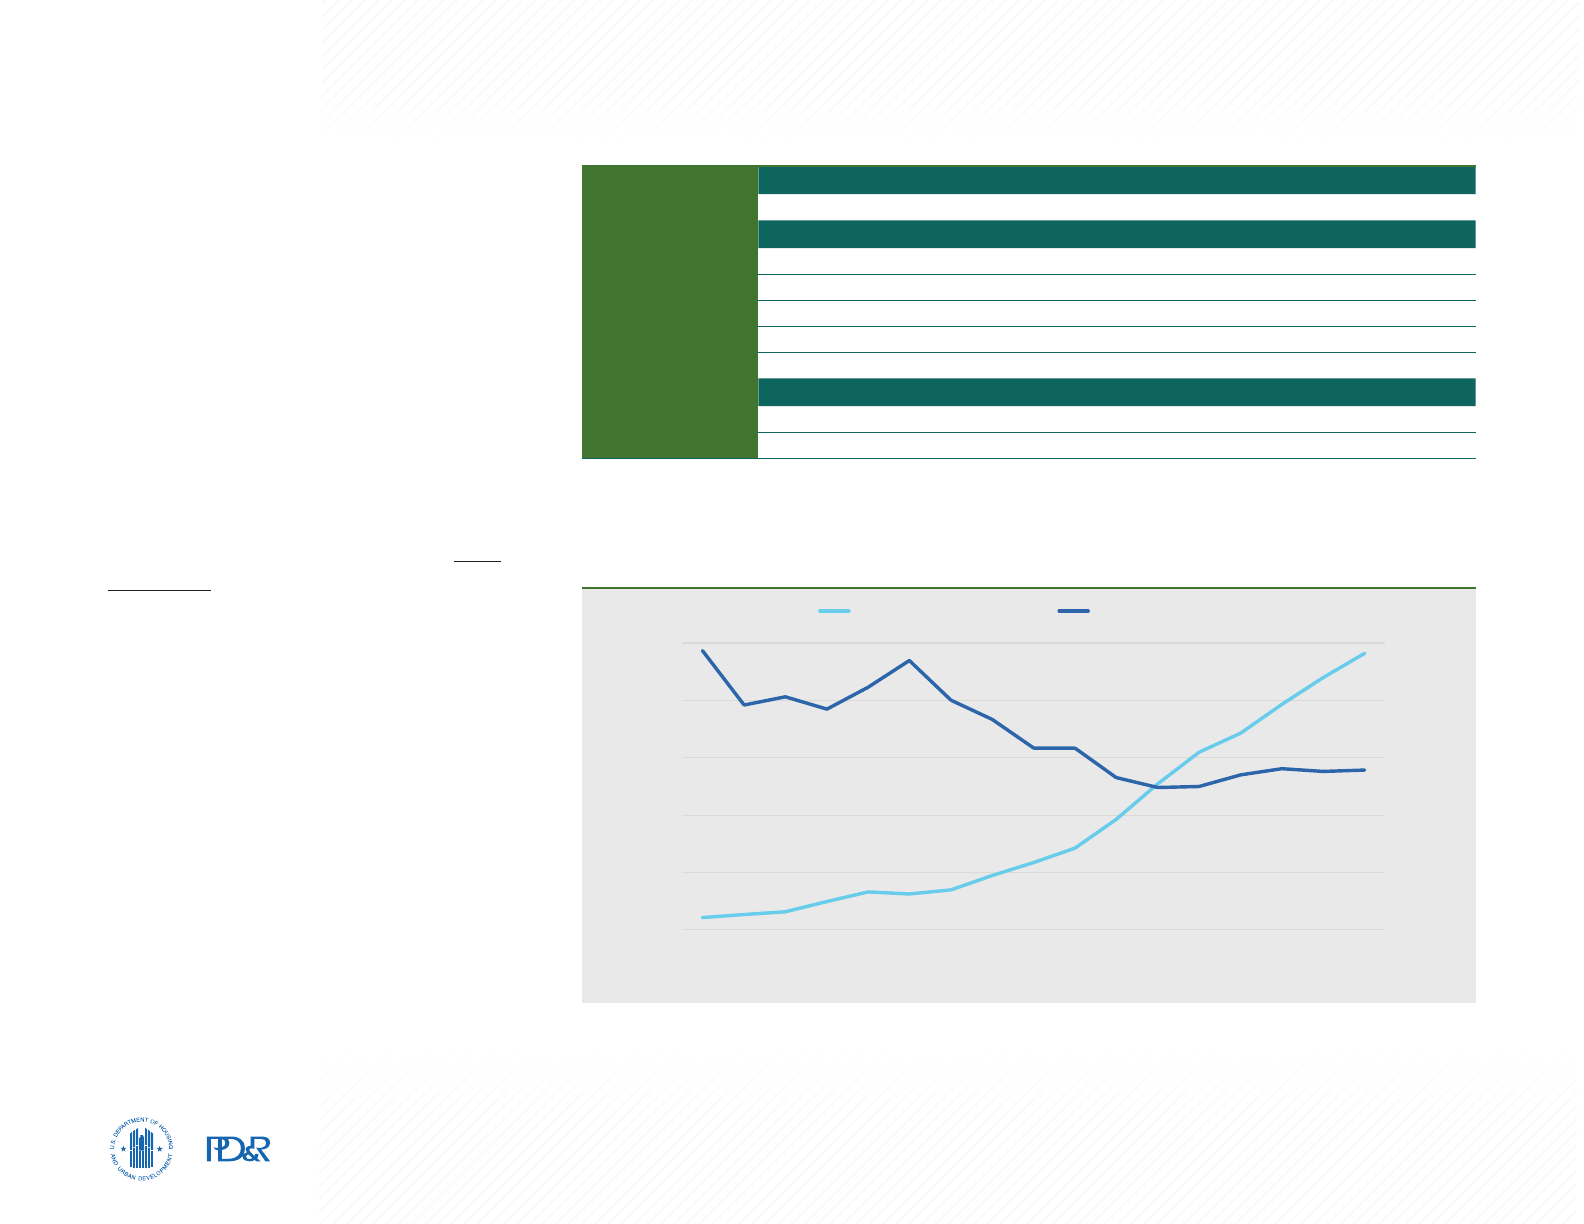
2001 Through 2008
Following an increase in nonfarm payrolls
in 2001, mainly due to a rise in the financial
activities sector of 3,000 jobs, or 6.9 percent,
total nonfarm payrolls declined from 2002
through 2003 by an average of 7,800 jobs, or
0.9 percent annually (Figure 3). From 2004
through 2008, strong economic growth coincided
with strong net in-migration, and payroll gains
occurred in 7 of the 11 nonfarm payroll sectors.
Payrolls increased by an average of 20,400
jobs, or 2.4 percent, annually, with the mining,
logging, and construction sector leading job
gains and accounting for 21 percent of the jobs
added as natural gas production from the Barnett
Shale natural gas fields increased. During this
time, the professional and business services
and the education and health services sectors
significantly contributed to the expansion and
increased by an average of 3,800 and 3,300
jobs, or 4.1 and 3.6 percent, annually.
2009 Through 2010
Economic conditions in the HMA weakened as a
result of the national recession that began in late
2007. From 2009 through 2010, nonfarm payrolls
fell by an average of 17,000 jobs, or 1.9 percent,
annually, to a low of 873,700 jobs in 2010. The
effects of the national recession were moderate
Economic Periods
of Significance
Note: Based on the 12-month moving average.
Sources: U.S. Bureau of Labor Statistics; National Bureau of Economic Research
National Recession Nonfarm Payrolls
1,250
1,150
1,050
950
850
750
Mar-00
Mar-01
Mar-02
Mar-03
Mar-04
Mar-05
Mar-06
Mar-07
Mar-08
Mar-09
Mar-10
Mar-11
Mar-12
Mar-13
Mar-14
Mar-15
Mar-16
Mar-17
Mar-18
Mar-19
Mar-20
Mar-21
Nonfarm Payrolls (in Thousands)
Figure 3. 12-Month Average Nonfarm Payrolls in the Fort Worth HMA
in the HMA compared with the nation, partly because of strong growth in the education and health
services and the government sectors, which increased annually by averages of 3,400 and 3,000 jobs,
or 3.3 percent and 2.4 percent, respectively. By contrast, job loss was greatest in the mining, logging,
and construction sector, which fell by an average of 7,900 jobs, or 11.7 percent, annually, accounting for
46 percent of all jobs lost during this period, as residential construction in the HMA declined.
2011 Through 2019
Economic conditions in the HMA began to improve in 2011, and by 2012 nonfarm payrolls had surpassed
the pre-recessionary high of 2008, reaching 927,300 jobs. From 2011 through 2014, job growth was
strong, increasing by an average of 25,600 jobs, or 2.8 percent, annually. Gains were strongest in the
mining, logging, and construction sector, which added an average of 4,100 jobs, or 6.6 percent, partly due
to relatively strong natural gas production in the HMA. Nonfarm payrolls moderated from 2015 through
2016, increasing by an average of 16,000 jobs, or 1.6 percent, annually, with all of the growth occurring in
the service-providing sectors. The transportation and utilities and the wholesale and retail trade sectors

Economic Conditions 8Fort Worth-Arlington, Texas Comprehensive Housing Market Analysis as of April 1, 2021
Comprehensive Housing Market Analysis Fort Worth-Arlington, Texas
U.S. Department of Housing and Urban Development, Office of Policy Development and Research
Commuting Patterns
With a robust highway system, including two interstate highways that traverse
the Dallas-Fort Worth-Arlington, TX MSA from east to west, many residents
of the HMA, particularly from Tarrant and Johnson Counties, commute to
Dallas County for work. The share of employed people commuting to Dallas
County has remained relatively constant since 2010. In 2018, 23 percent of
employed residents from Tarrant County commuted to Dallas County, which
was unchanged from 2010 (Census Bureau, OnTheMap, 2018 and 2010
data). Likewise, the percentage of employed residents commuting from
Johnson County to Dallas County during 2018 was 13 percent, which was
up 1 percentage point from 2010.
Employment Forecast
During the 3-year forecast period, nonfarm payrolls in the HMA are expected
to grow at an average of 2.7 percent annually. Job growth is expected to be
greatest during the first year of the forecast, with the recovery of all jobs
lost during the pandemic anticipated by the end of the first year. The goods-
producing and the service-providing sectors are both expected to contribute
to payroll growth during the next 3 years. Job gains are expected to be
strong in the transportation and utilities sector as demand for e-commerce
goods continues to expand. Hillwood Development Company, LLC, is planning
to begin construction on a 1.2 million square foot industrial building in the
AllianceTexas development, which is expected to be completed in 2022.
BNSF Railway Company announced an approximately $200 million expansion
to add a new double track from the Alliance Intermodal Facility in the city
of Fort Worth to the city of Cleburne in the southern portion of the HMA. As
the effects of the COVID-19 pandemic subside, the leisure and hospitality
sector is expected to grow. The $810 million second phase of the Texas Live!
development is expected to begin during the forecast period and create more
than 3,000 jobs. The second phase is expected to include 888 hotel rooms,
a new convention center, office space, a mixed-use residential building, and
additional dining, retail, and entertainment options.
led growth, both averaging 5,000 jobs annually, or 6.8 and 3.1 percent,
respectively. During this time, Amazon.com, Inc. built an e-fulfillment
center at AllianceTexas, which created 400 jobs. Close to the AllianceTexas
development, the Presidio Towne Crossing shopping center was built, with
a Target Corporation retail store as the anchor.
Nonfarm payroll growth accelerated from 2017 through 2019, averaging 28,100
jobs, or 2.7 percent, annually. During this time period, the service-providing
sectors accounted for 80 percent of job growth. The financial activities sector
grew the fastest during this time period, increasing 5.3 percent, or by an
average of 3,300 jobs, annually. The leisure and hospitality sector had the
largest job gains during the period, increasing by an average of 3,800 jobs,
or 3.2 percent. Texas Live!, an entertainment and hospitality district sited
between Globe Life Park, Globe Life Field, and AT&T Stadium in the city of
Arlington, opened in 2018, creating more than 1,000 permanent jobs. Other
sectors that grew substantially were the education and health services and
the professional and business services sectors, adding respective averages
of 3,600 and 3,500 jobs, or 2.7 and 3.0 percent, annually.
Population and Households 9Fort Worth-Arlington, Texas Comprehensive Housing Market Analysis as of April 1, 2021
Comprehensive Housing Market Analysis Fort Worth-Arlington, Texas
U.S. Department of Housing and Urban Development, Office of Policy Development and Research
Population and
Households
Current Population: 2.61 Million
Population growth has slowed since 2016
due to a slowdown in both net natural
change and net in-migration.
Population and
Migration Trends
As of April 1, 2021, the estimated population of
the Fort Worth HMA is approximately 2.61 million,
representing an average increase of 38,050, or
1.6 percent, annually since April 2010 (Table 3).
From 2000 to 2005, the population grew by an
average of 39,250, or 2.1 percent, annually, as net
in-migration slowed nearly every year (Figure 4)
in response to the economic downturn during the
early 2000s. The population increased by 53,100,
or 2.6 percent, annually, from 2005 to 2008 as
the economy in the HMA expanded. During this
time period, net in-migration grew to its highest
levels during the past two decades, averaging
32,250 people annually and accounting for
61 percent of the population growth. From
2008 to 2013, population growth slowed to
37,350 people, or 1.7 percent, annually, due to
the economic downturn in the HMA stemming
from the effects of the national recession of the
late 2000s. During that period, net in-migration
slowed to 18,450 people, whereas natural change
Notes: Data displayed are average annual totals. The forecast period is from the current date (April 1, 2021) to April 1, 2024.
Sources: U.S. Census Bureau; current to forecast—estimates by the analyst
60,000
50,000
40,000
30,000
20,000
10,000
0
2000-2001
2001-2002
2002-2003
2003-2004
2004-2005
2005-2006
2006-2007
2007-2008
2008-2009
2009-2010
2010-2011
2011-2012
2012-2013
2013-2014
2014-2015
2015-2016
2016-2017
2017-2018
2018-2019
2019-Current
Current-Forecast
Population Change
Net Natural Change Net Migration Population Growth
Figure 4. Components of Population Change in the Fort Worth HMA, 2000 Through the Forecast
Population
Quick Facts
2010 Current Forecast
Population 2,195,694 2,614,000 2,720,000
Average Annual Change 43,750 38,050 35,050
Percentage Change 2.2 1.6 1.3
Household
Quick Facts
2010 Current Forecast
Households 796,284 936,900 976,200
Average Annual Change 15,200 12,800 13,100
Percentage Change 2.1 1.5 1.4
Notes: Average annual changes and percentage changes are based on averages from 2000 to 2010, 2010 to current, and current to forecast.
The forecast period is from the current date (April 1, 2021) to April 1, 2024.
Sources: 2000 and 2010—2000 Census and 2010 Census; current and forecast—estimates by the analyst
Table 3. Fort Worth HMA Population and Household Quick Facts
averaged 18,900 people and accounted for 51 percent of the population change. Due to the economic
expansion in the HMA that began in 2011, the population grew steadily from 2013 to 2016, averaging
45,050 people or 1.9 percent annually, with net in-migration accounting for 61 percent of the growth,
averaging 27,550 people a year. Although the economy strengthened from 2016 to 2019, population
Population and Households 10Fort Worth-Arlington, Texas Comprehensive Housing Market Analysis as of April 1, 2021
Comprehensive Housing Market Analysis Fort Worth-Arlington, Texas
U.S. Department of Housing and Urban Development, Office of Policy Development and Research
growth slowed to an average of 38,600 people
annually, or 1.6 percent; both net in-migration and
net natural change slowed during this period—
averaging 23,350 and 15,250 people a year,
respectively. From 2019 to current, the pandemic
caused population growth to slow further to
30,400 people, or 1.2 percent, with a net in-
migration of 18,350 people.
Household Trends
Household growth in the HMA has generally
reflected population growth trends since 2000.
The current number of households in the HMA
is estimated at 936,900, representing an average
annual increase of 12,800 households, or
1.5 percent, since April 2010—a pace slightly
slower than the 1.6-percent population growth
rate in the HMA during the same period. The
number of households increased an average of
2.1 percent annually during the 2000s, slightly
slower than the 2.2-percent population growth
during the same period. Since 2010, there has
been an increase in the propensity to rent, with
renter households accounting for 36.2 percent of
all households in the HMA, up from 35.1 percent
during the 2000s (Figure 5).
Note: The current date is April 1, 2021.
Sources: 2000 and 2010—2000 Census and 2010 Census; current—estimates by the analyst
65.5
65.0
64.5
64.0
63.5
63.0
1,000,000
800,000
600,000
400,000
200,000
0
2000 2010 Current
Homeownership Rate (%)
Households
RenterOwner Homeownership Rate
64.1
64.9
63.8
Figure 5. Households by Tenure and Homeownership Rate in the Fort Worth HMA
Forecast
Population growth in the Fort Worth HMA is expected to continue during the 3-year forecast period, with
the population reaching 2.72 million by April 1, 2024, reflecting average annual growth of 35,050 people,
or 1.3 percent; that rate of growth is lower than the period since 2010 because net natural increase is
expected to continue slowing. As jobs lost from the pandemic are recovered and moderate economic
growth ensues, approximately 66 percent of the growth will come from net in-migration. Household
growth is expected to average 13,100, or 1.4 percent, annually, with the number of households in the HMA
reaching 976,200 by the end of the forecast period—a pace that is slightly faster than population growth.
Home Sales Market 11Fort Worth-Arlington, Texas Comprehensive Housing Market Analysis as of April 1, 2021
Comprehensive Housing Market Analysis Fort Worth-Arlington, Texas
U.S. Department of Housing and Urban Development, Office of Policy Development and Research
Home Sales Market
Market Conditions: Tight
During the 12 months ending March 2021,
total home sales and prices in the Fort
Worth HMA increased 3 and 7 percent,
respectively (Zonda).
Current Conditions
The sales housing market in the Fort Worth
HMA is currently tight, with an estimated sales
vacancy rate of 1.3 percent (Table 4), down from
2.1 percent in April 2010. The supply of homes in
the HMA fell from a 2.3-month supply in March
2020 to a 0.8-month supply in March 2021
(CoreLogic, Inc.). New and existing home sales in
the HMA increased to 63,650 homes sold during
the 12 months ending March 2021, up 3 percent
compared with the previous 12 months (Zonda)
but slower than the increase of 5 percent a year
earlier—partly because the number of existing
homes for sale declined as many people did not
want to show their homes to prospective buyers
during the pandemic. During the same period,
the average new and existing home sales price
increased 7 percent to $291,200.
New Home Sales and Prices
New home sales in the HMA peaked at 19,000
homes sold in 2006 (Figure 6) when job and
population growth combined with relaxed lending
standards contributed to strong home sales.
The number of new home sales subsequently
Home Sales
Quick Facts
Fort Worth HMA Nation
Vacancy Rate
1.3% NA
Months of Inventory
0.8 1.3
Total Home Sales
63,650 6,927,000
1-Year Change
3% 16%
New Home Sales Price
$322,800 $392,100
1-Year Change
2% 3%
Existing Home Sales Price
$283,600 $353,100
1-Year Change
8% 12%
Mortgage Delinquency Rate
4.1% 3.7%
NA = data not available.
Notes: The vacancy rate is as of the current date; home sales and prices are for the 12 months ending March 2021; and months of inventory and
mortgage delinquency data are as of March 2021. The current date is April 1, 2021.
Sources: National Association of Realtors; Census Bureau /HUD; CoreLogic, Inc.; HMA Sales and Prices—Zonda, with adjustments by the analyst
Table 4. Home Sales Quick Facts in the Fort Worth HMA
Source: Zonda, with adjustments by the analyst
80,000
70,000
60,000
50,000
40,000
30,000
20,000
10,000
0
Mar-06
Mar-07
Mar-08
Mar-09
Mar-10
Mar-11
Mar-12
Mar-13
Mar-14
Mar-15
Mar-16
Mar-17
Mar-18
Mar-19
Mar-20
Mar-21
Sales Totals
Existing Sales New Sales
Figure 6. 12-Month Sales Totals by Type in the Fort Worth HMA
declined, however, each of the next 5 years to a low of 4,000 homes sold in 2011, as demand for homes
fell due to the national housing crisis and economic downturn in the HMA. As economic conditions
improved, new home sales increased every year in the HMA. From 2012 through 2014, new home sales
Home Sales Market 12Fort Worth-Arlington, Texas Comprehensive Housing Market Analysis as of April 1, 2021
Comprehensive Housing Market Analysis Fort Worth-Arlington, Texas
U.S. Department of Housing and Urban Development, Office of Policy Development and Research
Note: From the 12 months ending November 2015 through October 2016, the average existing home sales price appears to break with the trendline
because sales of higher priced existing homes were relatively higher in November 2015.
Source: Zonda, with adjustments by the analyst
325,000
300,000
275,000
250,000
225,000
200,000
175,000
150,000
Mar-06
Mar-07
Mar-08
Mar-09
Mar-10
Mar-11
Mar-12
Mar-13
Mar-14
Mar-15
Mar-16
Mar-17
Mar-18
Mar-19
Mar-20
Mar-21
Average Sales Price ($)
Existing Sales Price New Sales Price
Figure 7. 12-Month Average Sales Price by Type of Sale in the Fort Worth HMA
increased by an average of 650 homes, or
14 percent, annually, to 5,925 homes sold as
job opportunities increased. As job growth in
the HMA moderated in 2015 and 2016, new
home sales increased by an average of 480, or
8 percent, annually. From 2017 through 2019, as
the economy in the HMA expanded more rapidly
with job growth occurring in many of the higher
paying sectors, new home sales increased by an
average of 880 homes, or 11 percent, annually,
to 9,550 homes sold in 2019. Due to a lack of
supply of existing homes available for sale and
rising demand during the pandemic, new home
sales during the 12 months ending March 2021
increased to 12,300, up 23 percent from a
year earlier.
The average new home sales price rose from
2006 through 2007 by an average of $13,700, or
7 percent, annually, to $216,500, as demand for
homes increased (Figure 7). After reaching a peak
of $218,200 in early 2008, the average new home
price in the HMA trended downward to $195,900
in 2010 because of the economic downturn
during that time. As economic conditions in the
HMA improved, new home sales prices increased
each year from 2011 through 2018, averaging a
gain of $15,400, or 6 percent, annually to reach
$319,000 before falling 1 percent in 2019. During
the 12 months ending March 2021, the average
new home sales price increased to a peak of
$322,800, up by $7,700, or 2 percent, from a
year earlier.
Existing Home Sales and Prices
Existing home sales, which includes regular resale and real estate owned (REO) home sales, averaged
48,150 homes annually from 2005 through 2006 when in-migration to the HMA peaked. Due to the
housing crisis and subsequent economic downturn in the HMA, existing home sales fell by an average of
3,700 homes, or 9 percent, annually from 2007 through 2011. From 2012 through 2019, as the economy in
the HMA expanded, existing homes sales increased by an average of 2,675 homes, or 7 percent, annually.
During the 12 months ending March 2021, existing home sales declined 1 percent from a year earlier to
51,350. By comparison, the 52,100 existing homes sold during the 12 months ending March 2020 was
a 3-percent increase from a year prior. The recent decline in existing home sales has coincided with a
decline in home sales inventory.
The average existing home sales price increased from 2006 through 2007 by an average of $8,850, or
5 percent, annually to $188,000, before falling 6 percent to a low of $164,600 in 2009 as mortgage
lending standards tightened and as the economy in the HMA began to contract. Beginning in mid-2010,
existing home prices began to rise and increased to $175,000 in 2011. Existing home prices increased
by an average of $10,850, or 6 percent, annually from 2012 through 2014 as the economy in the HMA
Home Sales Market 13Fort Worth-Arlington, Texas Comprehensive Housing Market Analysis as of April 1, 2021
Comprehensive Housing Market Analysis Fort Worth-Arlington, Texas
U.S. Department of Housing and Urban Development, Office of Policy Development and Research
expanded. A relatively large number of existing
homes sold in November 2015 were priced over
$2 million, which contributed to an increase in
the average existing home sales price in 2015
by $16,950, or 8 percent, to $224,500, before
adjusting to $220,800 in 2016. As job growth
began to accelerate, prices increased by an
average of $13,750, or 6 percent, annually from
2017 through 2019, reaching $276,600 in 2020.
During the 12 months ending March 2021, the
average sales price for existing homes rose to
$283,600, up 8 percent from a year ago.
Delinquent Mortgages
and REO Properties
In March 2021, 4.1 percent of home loans in the
Fort Worth HMA were seriously delinquent or had
transitioned into REO (real estate owned) status,
up from 1.1 percent a year earlier but less than the
peak of 6.3 percent in January 2010 caused by the
recession and foreclosure crisis (CoreLogic, Inc.).
By comparison, the national percentage of
seriously delinquent mortgages and REO
properties was 3.7 percent in March 2021, up
from 1.3 percent a year earlier but significantly
below the peak rate of 8.6 percent in January
2010. The rate of seriously delinquent mortgages
and REO properties in the Fort Worth HMA and
the nation have increased during the past year,
primarily because homeowners had greater
difficulty paying their mortgages due to job losses
during the COVID-19 pandemic.
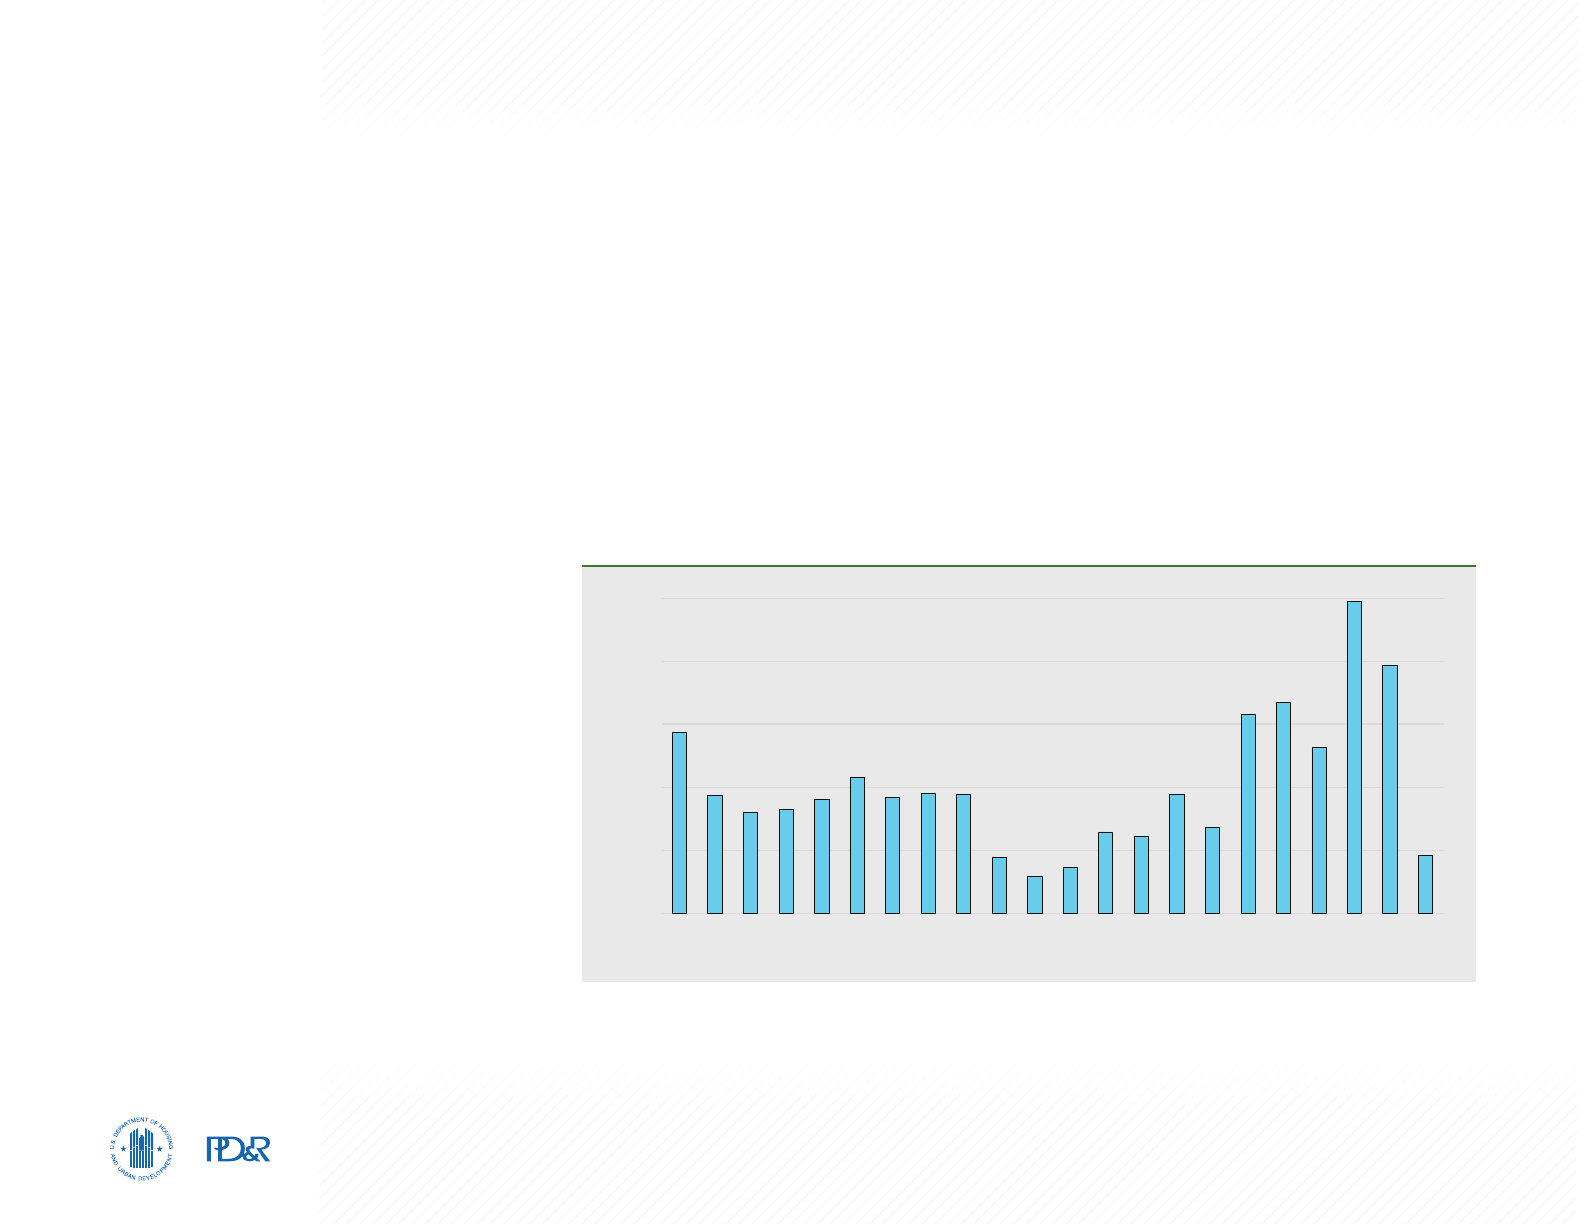
Sales Construction Activity
New home construction activity in the Fort Worth HMA, as measured by the number of single-family
homes, townhomes, and condominiums permitted, was higher during the 2000s, averaging 12,400 units
permitted annually, compared with the 2010s when an average of 7,650 units were permitted annually
(Figure 8). The number of homes permitted was high from 2000 through 2006, when an average of
14,400 homes were permitted annually because of relaxed mortgage lending standards combined with job
and population growth during the period. As lending standards became more stringent due to the housing
crisis, and economic conditions weakened as a result of the national recession, new home construction
activity in the HMA fell by 25 percent annually, from 2007 through 2010, to a low of 4,675 homes by 2011.
Sales construction activity increased to an average of 6,575 homes permitted annually from 2012 through
2016 as the economy in the HMA continued to recover following the recession of the late 2000s and in-
migration increased, which contributed to more homebuyers in the HMA. Although migration to the HMA
slowed beginning in 2017, a stronger pace of job growth contributed to greater demand for new homes in
the HMA, and sales construction activity rose to an average of 9,750 homes permitted annually from 2017
18,500
16,650
14,800
12,950
11,100
9,250
7,400
5,550
3,700
1,850
0
2000
2001
2002
2003
2004
2005
2006
2007
2008
2009
2010
2011
2012
2013
2014
2015
2016
2017
2018
2019
2020
2021
Single-Family Homes/Townhomes Condominiums
Notes: Includes single-family homes, townhomes, and condominiums. Data for 2021 are through March 2021.
Sources: U.S. Census Bureau, Building Permits Survey; 2000 through 2019—final data and estimates by the analyst; 2020 and 2021—preliminary
data and estimates by the analyst
Figure 8. Average Annual Sales Permitting Activity in the Fort Worth HMA

Home Sales Market 14Fort Worth-Arlington, Texas Comprehensive Housing Market Analysis as of April 1, 2021
Comprehensive Housing Market Analysis Fort Worth-Arlington, Texas
U.S. Department of Housing and Urban Development, Office of Policy Development and Research
through 2019. During the 12-months ending
March 2021, the number of homes permitted
averaged 12,350, or a 16-percent increase from
the same period a year earlier (preliminary data,
with adjustments by the analyst).
New Home Developments
Although new homes are being built throughout
the Fort Worth HMA, new home construction
has been more prevalent in north Fort Worth
as well as Wise and Parker Counties, which
allow for
easy access to the north Fort Worth/
AllianceTexas area of the HMA. Portions of
Johnson County and
southern Tarrant County,
which allow for easy access to north Fort Worth
and Dallas County (located to the east of the
HMA), have also had increased home construction.
New developments in Parker County include the
Silverstone Pearson Ranch development built by
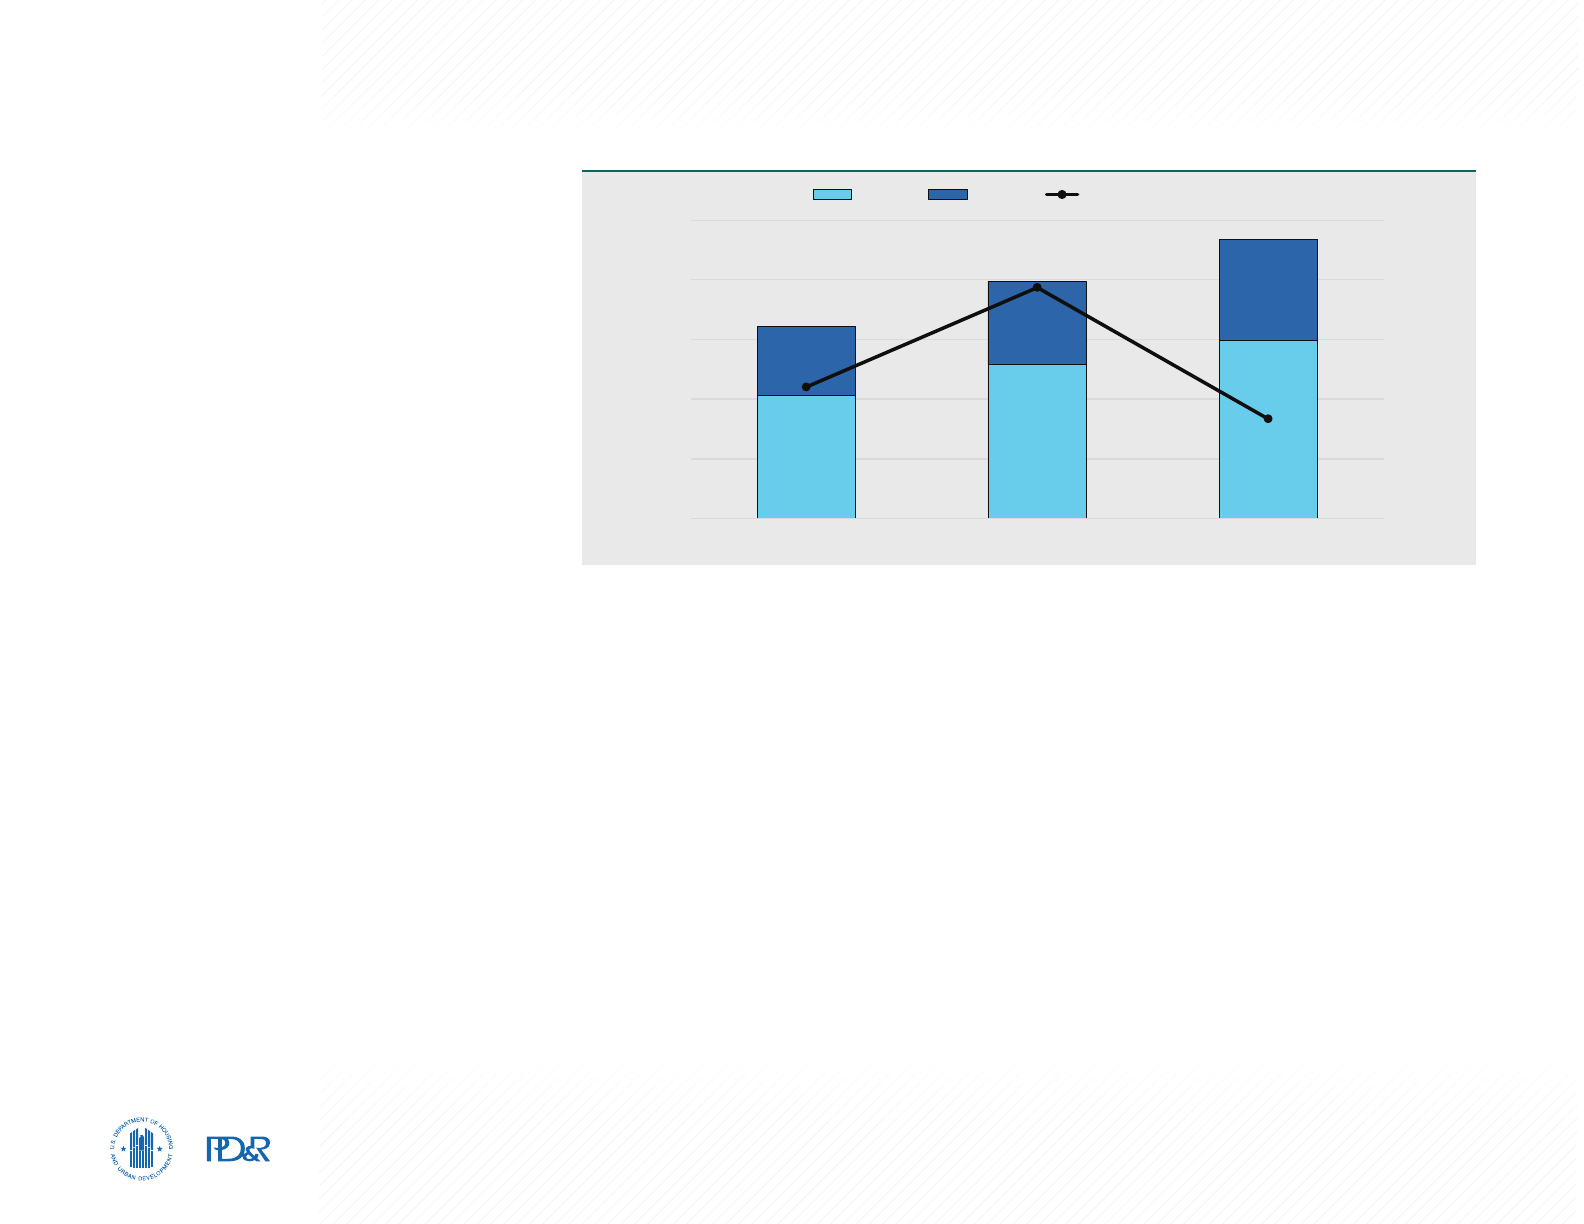
Table 5. Demand for New Sales Units in the Fort Worth HMA During the Forecast Period
Sales Units
Demand 28,700 Units
Under Construction 4,275 Units
Note: The forecast period is from April 1, 2021, to April 1, 2024.
Source: Estimates by the analyst
Riverside Homebuilders in the city of Weatherford, which has 70 homes planned at buildout; currently,
67 homes have been sold. Homes at the development are currently priced between $309,900 and
$394,900. In Tarrant County, the Silver Oak subdivision in the city of Mansfield, built by D.R. Horton, Inc.,
has 110 homes planned at buildout; currently, 100 homes have been sold, and the remaining 10 homes
under construction are available for sale. Homes at the Silver Oak development are currently priced
between $382,500 and $437,000.
Forecast
During the next 3 years, demand is expected for an estimated 28,700 homes in the Fort Worth HMA
(Table 5). The 4,275 single-family homes currently under construction will satisfy a portion of the estimated
demand during the forecast period. Demand is expected to be highest during the first year of the
forecast period.
Rental Market 15Fort Worth-Arlington, Texas Comprehensive Housing Market Analysis as of April 1, 2021
Comprehensive Housing Market Analysis Fort Worth-Arlington, Texas
U.S. Department of Housing and Urban Development, Office of Policy Development and Research
Rental Market
Market Conditions: Balanced
Apartment vacancy rates have remained
generally stable since 2019, and rents
continue to increase due to a high number
of newly completed market-rate apartment
units being added to the rental stock.
Current Conditions
and Recent Trends
Overall rental housing market conditions (which
includes single-family homes, townhomes, and
mobile homes for rent) in the Fort Worth HMA
are currently balanced, with an estimated rental
vacancy rate of 7.2 percent, down from 11.7 percent
in 2010 when the market was soft (Table 6). During
2015 through 2019, 48 percent of the occupied
rental units in the HMA were in structures with five
or more units, typically apartments (2015–2019
American Community Survey, 5-year data). The
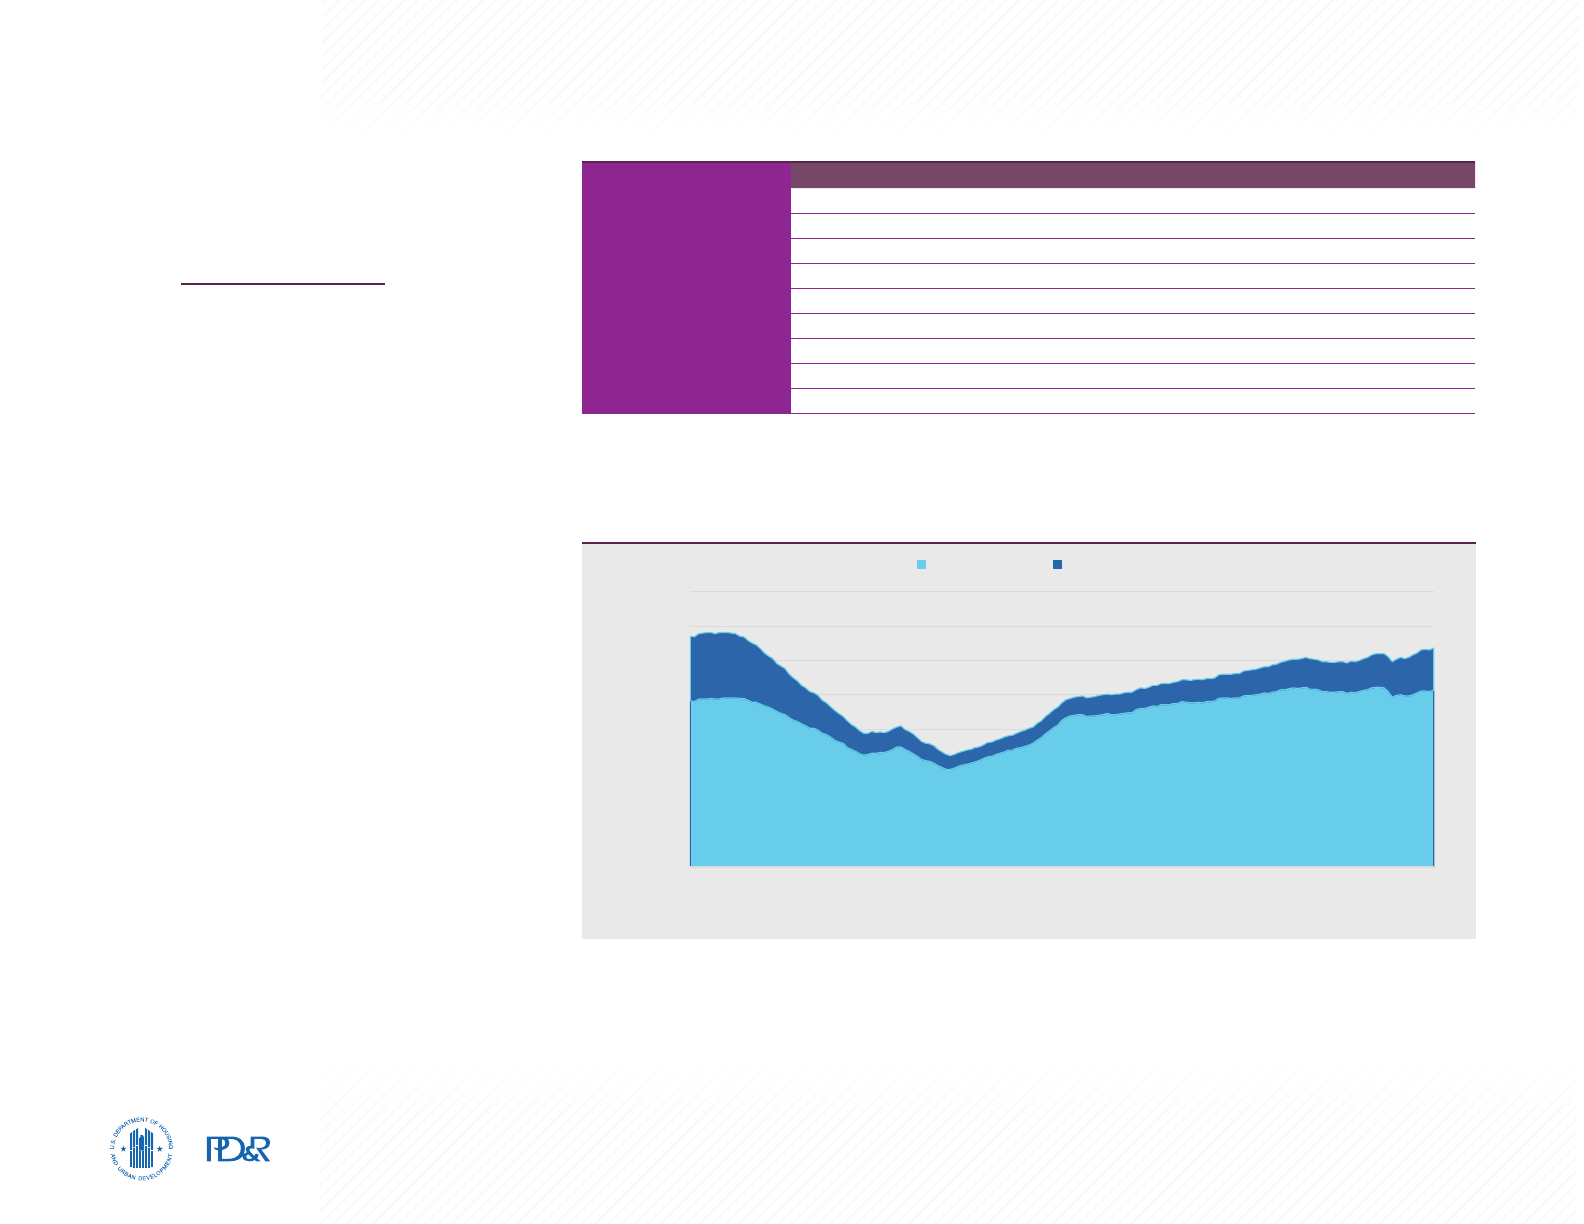
apartment market is also balanced. During the
first quarter of 2021, the HMA had a vacancy rate
of 5.6 percent, up from 5.5 percent during the
same period a year earlier (RealPage, Inc.). The
apartment vacancy rate ranged from 9.7 percent
during the first quarter of 2005 to 7.7 percent
during the first quarter of 2008 (Figure 9). From
the first quarter of 2009 through the first quarter
of 2010, the average apartment vacancy rate
increased by 0.9 of a percentage point to
9.4 percent as the rental market softened. As
Rental and
Apartment
Market
Quick Facts
2010 (%) Current (%)
Rental Vacancy Rate
11.7 7.2
2006–2010 (%) 2015–2019 (%)
Occupied Rental Units by Structure
Single-Family Attached & Detached
32.1 35.6
Multifamily (2–4 Units)
14.7 12.5
Multifamily (5+ Units)
48.8 47.9
Other (Including Mobile Homes)
4.4 4.0
1Q 2021 YoY Change
Apartment Vacancy Rate
5.6 0.1
Average Rent
$1,132 4%
1Q = first quarter. YoY= year-over-year.
Notes: The current date is April 1, 2021. Percentages may not add to 100 due to rounding.
Sources: 2010 vacancy rate—2010 Census; 2006–2010 and 2015–2019 American Community Survey, 5-year data; RealPage, Inc.
Table 6. Rental and Apartment Market Quick Facts in the Fort Worth HMA
1Q = first quarter.
Source: RealPage, Inc.
Vacancy Rate (%)
Average Monthly Rent ($)
Average Monthly Rent ($) Vacancy Rate (%)
10.0
8.0
6.0
4.0
2.0
0.0
1,150
1,050
950
850
750
650
1Q05
1Q06
1Q07
1Q08
1Q09
1Q10
1Q11
1Q12
1Q13
1Q14
1Q15
1Q16
1Q17
1Q18
1Q19
1Q20
1Q21
Figure 9. Apartment Rents and Vacancy Rates in the Fort Worth HMA
Rental Market 16Fort Worth-Arlington, Texas Comprehensive Housing Market Analysis as of April 1, 2021
Comprehensive Housing Market Analysis Fort Worth-Arlington, Texas
U.S. Department of Housing and Urban Development, Office of Policy Development and Research
Notes: Includes apartments and units intended for rental occupancy. Data for 2021 are through March 2021.
Sources: U.S. Census Bureau, Building Permits Survey; 2000 through 2019 final data and analyst estimates; 2020 and 2021–preliminary data and
estimates by the analyst
0
2,500
5,000
7,5 00
10,000
12,500
2000
2001
2002
2003
2004
2005
2006
2007
2008
2009
2010
2011
2012
2013
2014
2015
2016
2017
2018
2019
2020
2021
Figure 10. Average Annual Rental Permitting Activity in the Fort Worth HMA
many owner households shifted to renter status
during the early 2010s, and as migration to the
HMA increased, rental market conditions began to
tighten. The average apartment vacancy rate fell
from 8.0 percent during the first quarter of 2011,
when the market was balanced, to 5.0 percent
during the first quarters of 2016 and 2017, when
the market was tight. A rise in new apartment units
entering the market during the first quarter of 2019
increased the average vacancy rate to 5.6 percent.
The average apartment rent in the HMA increased
nearly each year during the past 17 years, with the
rent falling only in 2010. The average apartment
rent increased an average of 2 percent annually
from the first quarter of 2005 through the first
quarter of 2009 before falling 1 percent during the
first quarter of 2010, as the rental market softened.
The average apartment rent increased an average
of 3 percent annually from the first quarter of 2011
through the first quarter of 2014, before increasing
by an average of 5 percent annually through
the first quarter of 2020 as new apartment units
offered at higher rents entered the market in the
HMA. During the first quarter of 2021, the average
rent was $1,132, an increase of 4 percent from the
same period a year earlier.
Market Conditions
by Geography
During the first quarter of 2021, the South
Arlington/Mansfield market area had the lowest
average vacancy rate among the 14 RealPage, Inc.-defined market areas (hereafter, market areas) in the
Fort Worth HMA at 3.9 percent, with an average rent of $1,232, in part due to the proximity of employment
centers within the HMA and Dallas County. By contrast, the highest vacancy rate, at 6.8 percent, was in
the East Fort Worth market area, the second most affordable area of the HMA, where the average age of
apartment units is the oldest, with an average asking rent of $947 during the first quarter of 2021.
Rental Construction Activity
Rental construction activity in the Fort Worth HMA, as measured by the number of rental units permitted,
has recently been at or above annual rental construction activity levels from the 2000s through mid-2010s,
peaking in 2019 (Figure 10). During the 2010s, apartment construction notably increased in the north and
central areas of the city of Fort Worth. During the 12 months ending March 2021, 9,650 units were permitted,
down 18 percent compared with a year earlier (preliminary data, with adjustments by the analyst). From
2000 through 2008, rental construction activity averaged 4,875 units permitted annually. By comparison,
from 2009 through 2011, rental construction activity averaged 1,825 units annually, as builders responded to

Rental Market 17Fort Worth-Arlington, Texas Comprehensive Housing Market Analysis as of April 1, 2021
Comprehensive Housing Market Analysis Fort Worth-Arlington, Texas
U.S. Department of Housing and Urban Development, Office of Policy Development and Research
increasing vacancy rates from 2009 through 2010.
Rental demand increased as the economy in the
HMA expanded, and rental construction activity
averaged 5,100 units annually from 2012 through
2017. Rental construction activity slowed in 2018 as
builders responded to the influx of new apartment
supply from relatively high levels of construction
during 2016 and 2017. As the pace of economic
expansion in the HMA increased, construction
activity increased by 88 percent in 2019 before
beginning to slow in 2020.
New Apartment Developments
Among several recently completed apartment
developments is the 250-unit Alleia at Presidio, a
market-rate property that opened in late 2020 on
the north side of Fort Worth, with rents starting at $1,213, $1,849, and $2,299 for one-, two-, and three-
bedroom units, respectively. The 408-unit Presidium Revelstoke, a market-rate apartment development
in Fort Worth, near the AllianceTexas area, was also built in 2020, with rents for one-, two-, and three-
bedroom units starting at $1,275, $1,760, and $2,455, respectively.
Forecast
During the forecast period, demand is estimated for 18,000 new rental units in the Fort Worth HMA
(Table 7). Demand is expected to increase in the second and third years of the forecast period because
of increasing net in-migration and improving economic conditions. The 12,700 units currently under
construction are expected to satisfy demand through the second year of the forecast period.
Note: The forecast period is April 1, 2021, to April 1, 2024.
Source: Estimates by the analyst
Rental Units
Demand 18,000 Units
Under Construction 12,700 Units
Table 7. Demand for New Rental Units in the Fort Worth HMA During the Forecast Period
Terminology Definitions and Notes 18Fort Worth-Arlington, Texas Comprehensive Housing Market Analysis as of April 1, 2021
Comprehensive Housing Market Analysis Fort Worth-Arlington, Texas
U.S. Department of Housing and Urban Development, Office of Policy Development and Research
Terminology Definitions and Notes
A. Definitions
Building Permits
Building permits do not necessarily reflect all residential building activity that occurs in an HMA. Some units are constructed or created without a building
permit or are issued a different type of building permit. For example, some units classified as commercial structures are not reflected in the residential building
permits. As a result, the analyst, through diligent fieldwork, makes an estimate of this additional construction activity. Some of these estimates are included in
the discussions of single-family and multifamily building permits.
Demand
The demand estimates in the analysis are not a forecast of building activity. They are the estimates of the total housing production needed to achieve a
balanced market at the end of the 3-year forecast period given conditions on the as-of date of the analysis, growth, losses, and excess vacancies. The
estimates do not account for units currently under construction or units in the development pipeline.
Forecast Period 4/1/2021–4/1/2024—Estimates by the analyst.
Home Sales/
Home Sales
Prices
Includes single-family, townhome, and condominium sales.
Net Natural
Change
Resident births minus resident deaths.
Rental Market/
Rental Vacancy
Rate
Includes apartments and other rental units such as single-family, multifamily, and mobile homes.
Seriously
Delinquent
Mortgages
Mortgages 90+ days delinquent or in foreclosure.

Terminology Definitions and Notes 19Fort Worth-Arlington, Texas Comprehensive Housing Market Analysis as of April 1, 2021
Comprehensive Housing Market Analysis Fort Worth-Arlington, Texas
U.S. Department of Housing and Urban Development, Office of Policy Development and Research
B. Notes on Geography
1.
The metropolitan division definition noted in this report is based on the delineations established by the Office of Management and Budget (OMB) in the OMB
Bulletin dated April 10, 2018.
2. Urbanized areas are defined using the U.S. Census Bureau 2010 Census Urban and Rural Classification and the Urban Area Criteria.
C. Additional Notes
1.
This analysis has been prepared for the assistance and guidance of HUD in its operations. The factual information, findings, and conclusions may also be
useful to builders, mortgagees, and others concerned with local housing market conditions and trends. The analysis does not purport to make determinations
regarding the acceptability of any mortgage insurance proposals that may be under consideration by the Department.
2.
The factual framework for this analysis follows the guidelines and methods developed by the Economic and Market Analysis Division within HUD. The analysis
and findings are as thorough and current as possible based on information available on the as-of date from local and national sources. As such, findings or
conclusions may be modified by subsequent developments. HUD expresses its appreciation to those industry sources and state and local government officials
who provided data and information on local economic and housing market conditions.
D. Photo/Map Credits
Cover Photo iStock
Contact Information
Nancy Smith, Economist
Fort Worth HUD Regional Office
817–978–9415
nancy.[email protected]
